

Enter Password
Designed an insight-driven mobile MVP that helps users identify early signs of endometriosis by contextualizing menstrual data against medical norms.
Jan 2024~Feb 2024
UI Designer
Reanne (株式会社asai)
Figma
Zoom
Notion
Procreate
Endometriosis and similar conditions often go undiagnosed for years, despite affecting a large number of women. Limited awareness and accessible resources, particularly in Japan, make early detection difficult. The challenge was to design a solution that helps users recognize potential symptoms early by making complex health information more accessible and actionable.
Designed an MVP for Reanne, a Japanese women’s health app that helps users identify potential signs of endometriosis through symptom tracking and data comparison. Unlike traditional period trackers, the app enables users to log factors such as mood and flow, and contextualizes this data against medical norms and aggregated user data to surface potential abnormalities.
Due to the early-stage nature of the product, the scope focused on core MVP screens, with more advanced features, such as blood analysis, planned for future iterations.
I conducted a cross-market analysis of Japanese and Western apps to understand differences in UI patterns, information hierarchy, and user expectations. While Japanese apps often favor dense, familiar layouts, Western apps emphasize simplicity and user-centered flows. I used these insights to balance familiarity with clarity, creating a more intuitive experience.
Key Insights
Onboarding commonly includes questionnaires to personalize the experience
Visual design trends toward soft, illustration-led UI
Educational content is widely offered
Advanced insights are often gated behind premium tiers
These insights informed decisions around onboarding, personalization, and feature prioritization.

Competitive analysis: summarized overview of selected apps.

Feature comparison across apps, including calendar, mood tracking, and onboarding.
My teammate conducted interviews with women who had experienced symptoms of endometriosis or had been diagnosed. The findings were synthesized into journey maps, capturing key stages such as initial symptom awareness, sources of information (e.g., internet, friends, family), and first interactions with healthcare providers.

Journey made by my teammate
To synthesize the research, my teammate then developed the persona below based on interview findings. A key insight was the need to help users recognize abnormal symptoms and guide them toward seeking medical attention. The persona captures typical period patterns, coping behaviors, and core motivations, providing a clear foundation for design decisions.

Based on research insights and competitive references, I created low-fidelity wireframes to define the initial structure and user flows.

I translated initial concepts into mid-fidelity wireframes in Figma, structuring them into key user flows to define the core experience.

Select wireframes

Snapshot of the Figma Board
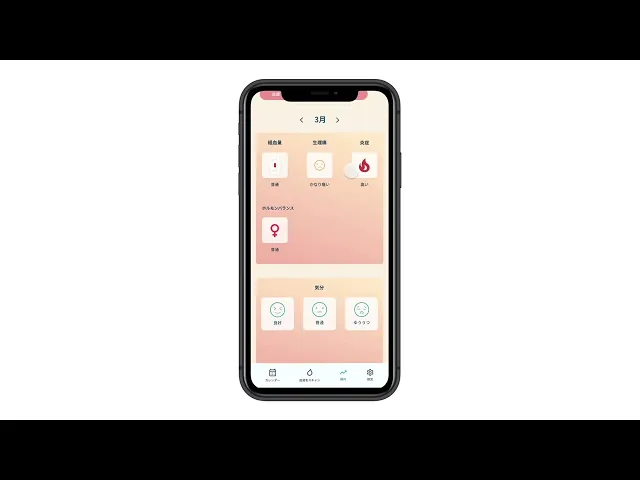
Building on the mid-fidelity wireframes, I developed high-fidelity designs guided by the visual direction established in the mood board and existing brand colors, refining hierarchy and overall clarity.
I also defined two key user flows, one for first-time users and one for returning users. For returning users, previously entered information (e.g., height, weight, age) is saved and editable, reducing friction and streamlining repeat usage.

Hi-fi Wireframes and flow for first time users

Hi-fi Wireframes for repeat users
Several revisions were made from the initial low-fidelity wireframes to improve clarity and data quality.
Flow Tracking
Initial concepts used abstract teardrop shapes to represent flow heaviness. This was replaced with period pad illustrations, enabling users to better relate their experience to real-world references. Additional options (e.g., daytime/nighttime pads) and contextual descriptions such as 「先月より多い」 were introduced to further support accurate input.

Mood Tracking
Originally designed as a slider from “poor” to “good,” this was replaced with selectable mood tags (e.g., depressed, irritated, content, happy). This allows users to capture more nuanced emotional states and improves the accuracy of collected data.

After iterative refinements, the designs were finalized and handed off to the client who was very happy with the product. View the complete prototype below.
Designing for a sensitive health context highlighted how difficult it can be for users to interpret subjective symptoms. Many struggle to distinguish between “normal” and abnormal experiences, reinforcing the need for clarity, reassurance, and guidance in the design.
A core challenge was translating complex medical concepts into an intuitive experience. The product aimed to go beyond simple tracking by helping users identify potential abnormalities based on scientific benchmarks, requiring a careful balance between accuracy and simplicity. I also needed to limit input complexity during onboarding, capturing meaningful data without overwhelming users.
Additional constraints included incomplete product logic and legal limitations, which restricted certain features (e.g., calendar, medical recommendations). This required focusing the design on awareness and prompting action rather than diagnosis.
What I would improve
With more time, I would deepen the research by refining interview frameworks and synthesizing insights more systematically to further inform design decisions.
© 2026 Crystal Ma. All rights reserved.